
Hierarchical Clustering Example with Credit Card Dataset (Bank Churners)
This guide provides a comprehensive, beginner-friendly demonstration of hierarchical clustering using the Credit Card Customers (Bank Churners) dataset, available in CSV format (BankChurners.csv) from Kaggle. The provided Python code performs agglomerative hierarchical clustering, visualizes the clustering process through a dendrogram, and plots the resulting clusters in a scatter plot. The code is designed to be robust, addressing common issues such as missing values and non-numerical columns, and includes detailed explanations to facilitate understanding for those new to data science.
Dataset Description
The Credit Card Customers (Bank Churners) dataset is a rich resource for analyzing customer behavior in the context of credit card usage. Below are the key details:
- Source: Credit Card Customers on Kaggle
- File Name: BankChurners.csv
- Features: The dataset includes 23 attributes, encompassing both numerical and categorical variables. Key attributes include:
- CLIENTNUM: Unique customer identifier (non-numerical, excluded from clustering).
- Customer_Age: Age of the customer (numerical).
- Credit_Limit: Credit limit on the card (numerical).
- Total_Revolving_Bal: Total revolving balance on the card (numerical).
- Total_Trans_Amt: Total transaction amount, serving as a proxy for purchases (numerical).
- Total_Trans_Ct: Total transaction count (numerical).
- Additional numerical features: Months_on_book, Dependent_count, Total_Relationship_Count, Months_Inactive_12_mon, Contacts_Count_12_mon.
- Categorical features: Gender, Education_Level, Marital_Status, Attrition_Flag (excluded from clustering).
- Instances: 10,127 customer records.
- Purpose: The objective is to cluster customers based on their credit card usage patterns, such as identifying high spenders, low-balance users, or other behavioral segments.
- Access Note: A Kaggle account may be required to download the dataset. After downloading, save BankChurners.csv in the same directory as your Python script or specify the correct file path in the code. Download Now
Instructions for Use
To successfully execute the clustering analysis, follow these steps:
- Download the Dataset: Obtain BankChurners.csv from the Kaggle dataset page. Download Now
- Set Up the Environment: Place the CSV file in the same directory as your Python script or update the file path in the code. Install the necessary Python libraries as outlined below.
- Run the Code: Execute the provided Python script to perform clustering and generate visualizations.
Prerequisites
The code relies on several Python libraries for data processing, clustering, and visualization. Install them using the following command:
pip install scikit-learn pandas matplotlib scipy numpyThese libraries include:
- scikit-learn: For clustering and data preprocessing.
- pandas: For data loading and manipulation.
- matplotlib: For plotting the dendrogram and scatter plot.
- scipy: For hierarchical clustering computations.
- numpy: For numerical operations.
Complete Python Code
The following Python script performs the entire clustering process, from data loading to visualization:
import numpy as np
import pandas as pd
import matplotlib.pyplot as plt
from sklearn.cluster import AgglomerativeClustering
from sklearn.preprocessing import StandardScaler
from scipy.cluster.hierarchy import dendrogram, linkage

# Step 1: Load the Credit Card dataset from CSV
# Replace 'BankChurners.csv' with the path to your downloaded file
data = pd.read_csv('BankChurners.csv')

# Step 2: Inspect column names to verify dataset structure
print("Column names in the dataset:", data.columns.tolist())

# Step 3: Preprocess the data
# Drop non-numerical column (CLIENTNUM) and exclude categorical columns
data = data.drop('CLIENTNUM', axis=1)

# Select numerical columns for clustering
numerical_columns = [
    'Customer_Age', 'Dependent_count', 'Months_on_book',
    'Total_Relationship_Count', 'Months_Inactive_12_mon',
    'Contacts_Count_12_mon', 'Credit_Limit', 'Total_Revolving_Bal',
    'Total_Trans_Amt', 'Total_Trans_Ct'
]
data = data[numerical_columns]

# Handle missing values by filling with column means
data = data.fillna(data.mean())

# Select features for clustering (Total_Revolving_Bal, Total_Trans_Amt, Credit_Limit)
X = data[['Total_Revolving_Bal', 'Total_Trans_Amt', 'Credit_Limit']].values

# Standardize the features to ensure equal weighting
scaler = StandardScaler()
X_scaled = scaler.fit_transform(X)

# Step 4: Compute the linkage matrix for hierarchical clustering
# Using Ward's method for linkage
linkage_matrix = linkage(X_scaled, method='ward')

# Step 5: Plot the dendrogram
plt.figure(figsize=(12, 6))
dendrogram(linkage_matrix, truncate_mode='level', p=3)  # Show top 3 levels for clarity
plt.title('Dendrogram for Hierarchical Clustering (Bank Churners Dataset)')
plt.xlabel('Data Points (or Clusters)')
plt.ylabel('Distance')
plt.show()

# Step 6: Perform agglomerative clustering
# Choose 3 clusters based on the dendrogram
model = AgglomerativeClustering(n_clusters=3, linkage='ward')
labels = model.fit_predict(X_scaled)

# Step 7: Visualize the clusters (using Total_Revolving_Bal and Total_Trans_Amt)
plt.figure(figsize=(8, 6))
plt.scatter(X[:, 0], X[:, 1], c=labels, cmap='viridis', s=50)
plt.title('Hierarchical Clustering Results (Bank Churners Dataset)')
plt.xlabel('Total Revolving Balance ($)')
plt.ylabel('Total Transaction Amount ($)')
plt.show()

# Step 8: Print number of points in each cluster
print("Number of points in each cluster:", np.bincount(labels))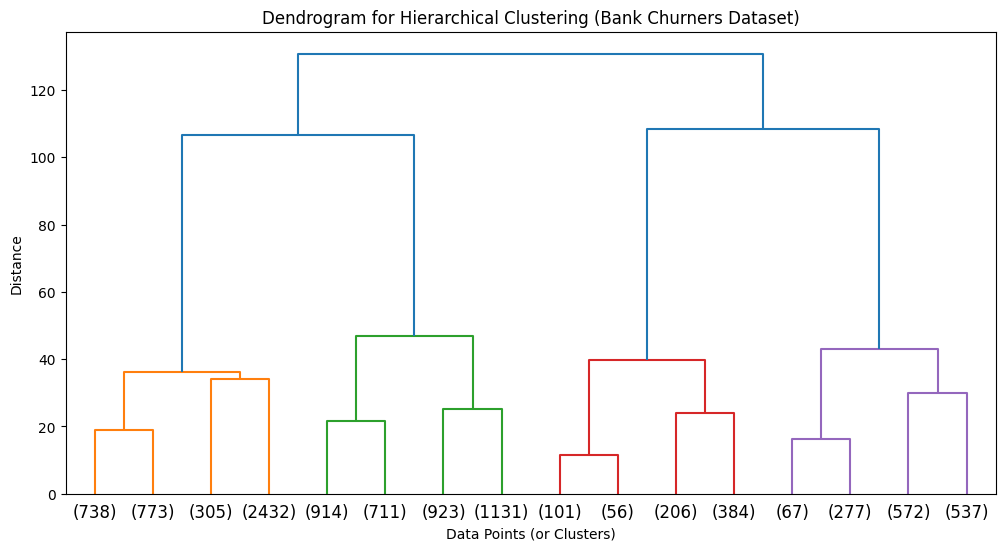
Detailed Explanation of the Code
The code is structured to guide users through the clustering process with clear, logical steps. Below is a detailed breakdown of each step:
- Dataset Loading:
- The pandas.read_csv function loads the BankChurners.csv file into a DataFrame.
- Users must ensure the file is accessible in the specified path to avoid file-not-found errors.
- Column Inspection:
- The code prints the dataset’s column names using data.columns.tolist() to verify the structure.
- This step helps confirm the presence of expected columns, such as Customer_Age and Credit_Limit, and identifies any discrepancies.
- Data Preprocessing:
- Dropping Non-Numerical Columns: The CLIENTNUM column, a unique identifier, is removed as it is non-numerical and irrelevant for clustering.
- Selecting Numerical Columns: Ten numerical columns are selected to avoid errors from categorical features like Gender or Education_Level. These columns include Customer_Age, Dependent_count, Months_on_book, Total_Relationship_Count, Months_Inactive_12_mon, Contacts_Count_12_mon, Credit_Limit, Total_Revolving_Bal, Total_Trans_Amt, and Total_Trans_Ct.
- Handling Missing Values: Missing values are filled with the mean of each column using data.fillna(data.mean()) to ensure complete data for clustering.
- Feature Selection for Clustering: Three features—Total_Revolving_Bal, Total_Trans_Amt, and Credit_Limit—are chosen for clustering to simplify the analysis and visualization.
- Feature Standardization: The StandardScaler is applied to standardize the selected features, ensuring that differences in scale (e.g., between credit limits and transaction amounts) do not skew the clustering results.
- Linkage Matrix Computation:
- The linkage function from scipy.cluster.hierarchy computes the hierarchical clustering structure using Ward’s method, which minimizes the variance within clusters during merges.
- The standardized features (X_scaled) are used to ensure accurate distance calculations.
- Dendrogram Visualization:
- A dendrogram is plotted using the dendrogram function, illustrating the hierarchical merging process.
- The truncate_mode=’level’ and p=3 parameters limit the display to the top three levels, making the plot readable given the large dataset (10,127 customers).
- The x-axis represents data points or clusters, and the y-axis shows the distance at which merges occur.
- Agglomerative Clustering:
- The AgglomerativeClustering class from scikit-learn is used to assign customers to three clusters, a number chosen based on the dendrogram’s structure.
- Ward’s linkage method is specified to maintain consistency with the linkage matrix.
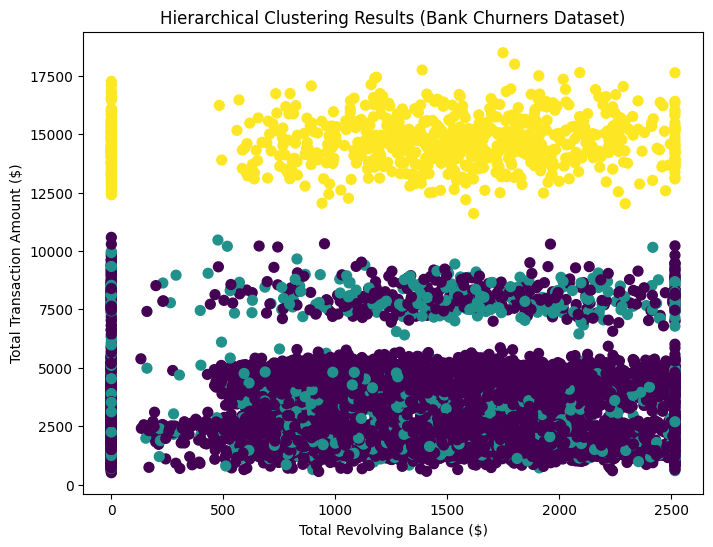
- Cluster Visualization:
- A scatter plot is generated using matplotlib, plotting Total_Revolving_Bal against Total_Trans_Amt.
- Points are colored by cluster labels using the viridis colormap, allowing visual identification of customer segments.
- Cluster Size Output:
- The np.bincount(labels) function counts the number of customers in each cluster, providing insight into the distribution of customers across segments.
Additional Insights
Hierarchical clustering is a powerful technique for uncovering patterns in data without requiring predefined labels. In the context of the Bank Churners dataset, the clustering results can inform business strategies, such as targeting high spenders with premium offers or identifying low-balance users for retention campaigns. The use of Ward’s method ensures that clusters are cohesive, minimizing within-cluster variance, which is particularly suitable for financial data where customer behaviors may vary widely.
For those interested in extending this analysis, consider the following:
- Feature Engineering: Create new features, such as the ratio of Total_Trans_Amt to Credit_Limit, to capture additional aspects of customer behavior.
- Cluster Validation: Use metrics like the silhouette score (available in scikit-learn) to evaluate the quality of the clusters.
- Integration with Other Analyses: Combine clustering results with predictive modeling (e.g., churn prediction) to develop a comprehensive customer segmentation strategy.